
The previous post introduced the ESPELETIA futurism tool. Here this is combined with key emergent and future technology drivers to deliver The Futurology Grid, a useful framework for practical futurism.
The nine dimensions of the ESPELETIA tool are the coloured column headings in the table below.
The details of each are as follows:
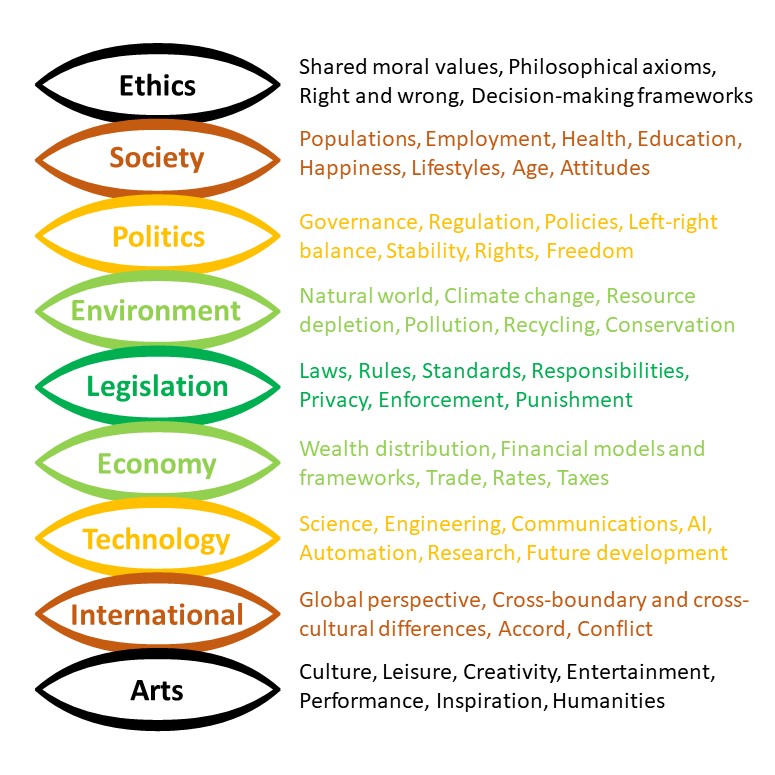
These identify, and serve as reminders of, the essential aspects/dimensions to consider when attempting to identify the development and impact of emergent and future technologies. Here, the technologies themselves are considered in more detail.
There are perhaps five broad categories of influential technology drivers:
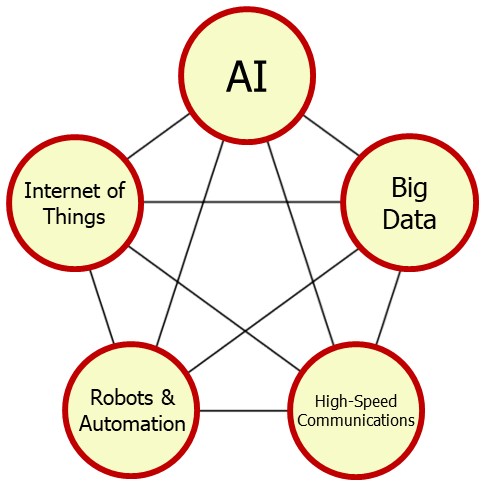
In more detail:
- Artificial Intelligence: Generally the use of software to calculate or make decisions traditionally taken by humans, including the specific role of machine learning
- Internet of Things: The embedding of smart identification, sensing or capability in devices and items to automate processing in a connected environment
- Big Data Analytics: Capture and processing of large quantities of multi-layered data by dimension reduction techniques for a variety of purposes
- Robotics and Automation: Hardware (possibly supported by AI software) to make (e.g. repetitive) tasks faster, more efficient, convenient, safer, etc.
- High-Speed Communications (Including Internet Technologies): The links and networks, of ever-increasing data-rates (capacities and speeds) that connect all of the above
And this is where it gets interesting! because these technologies, as disruptive as they are in isolation, don’t work in isolation, or at least won’t in the brave new world: they’ll work together. Trying to predict the technological advancement, and impact, of any one of them five or ten years ahead is challenging enough but prophesising on them in integrated form is very hard indeed.
However, there’s more: an essential extra driver (maybe more than one) but we don’t know what it is yet!
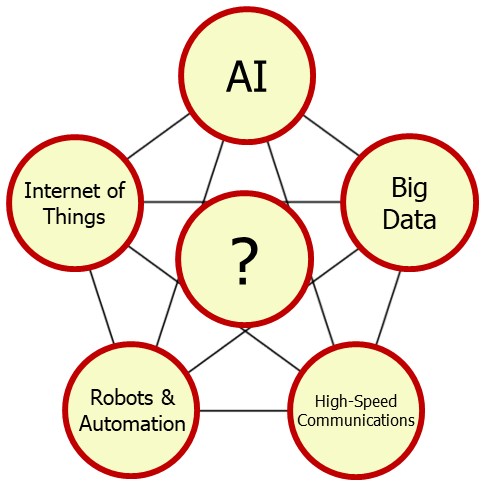
This is the ‘big thing’ we can’t see from here. Futurism successes essentially entail correctly predicting things that happen. Failures, on the other hand, fall, loosely into two categories:
- Incorrectly predicting things that don’t happen
- Not predicting things that do happen
The second category are the developments that come out of nowhere, the ‘unknown unknowns’. (See the Futurology Metric post for a light-hearted discussion.)
There’s usually something. The Internet itself was a great example a few decades ago. You only have to read some science fiction from last century to see how the most imaginative of writers fail to see the ‘hidden’ or ‘surprise’ new technology.

So we have to cater for, or at least try to consider, the big ‘disruptive’ technology that’s not yet in view: impossible in a real sense, of course, but remember ESPELETIA was only really a checklist, an aide-memoire, and so are the key technologies above. Not only that but, just as the ‘visible’ drivers work together, so presumably will the new technology integrate with them to produce something even more impressive. (We just don’t know what it might be yet.) There may be others so adding the ? Factor category serves a dual purpose:
- A reminder of the ‘big thing we can’t see’ angle
- Any visible emergent or future technologies that don’t fit easily into the five categories above.
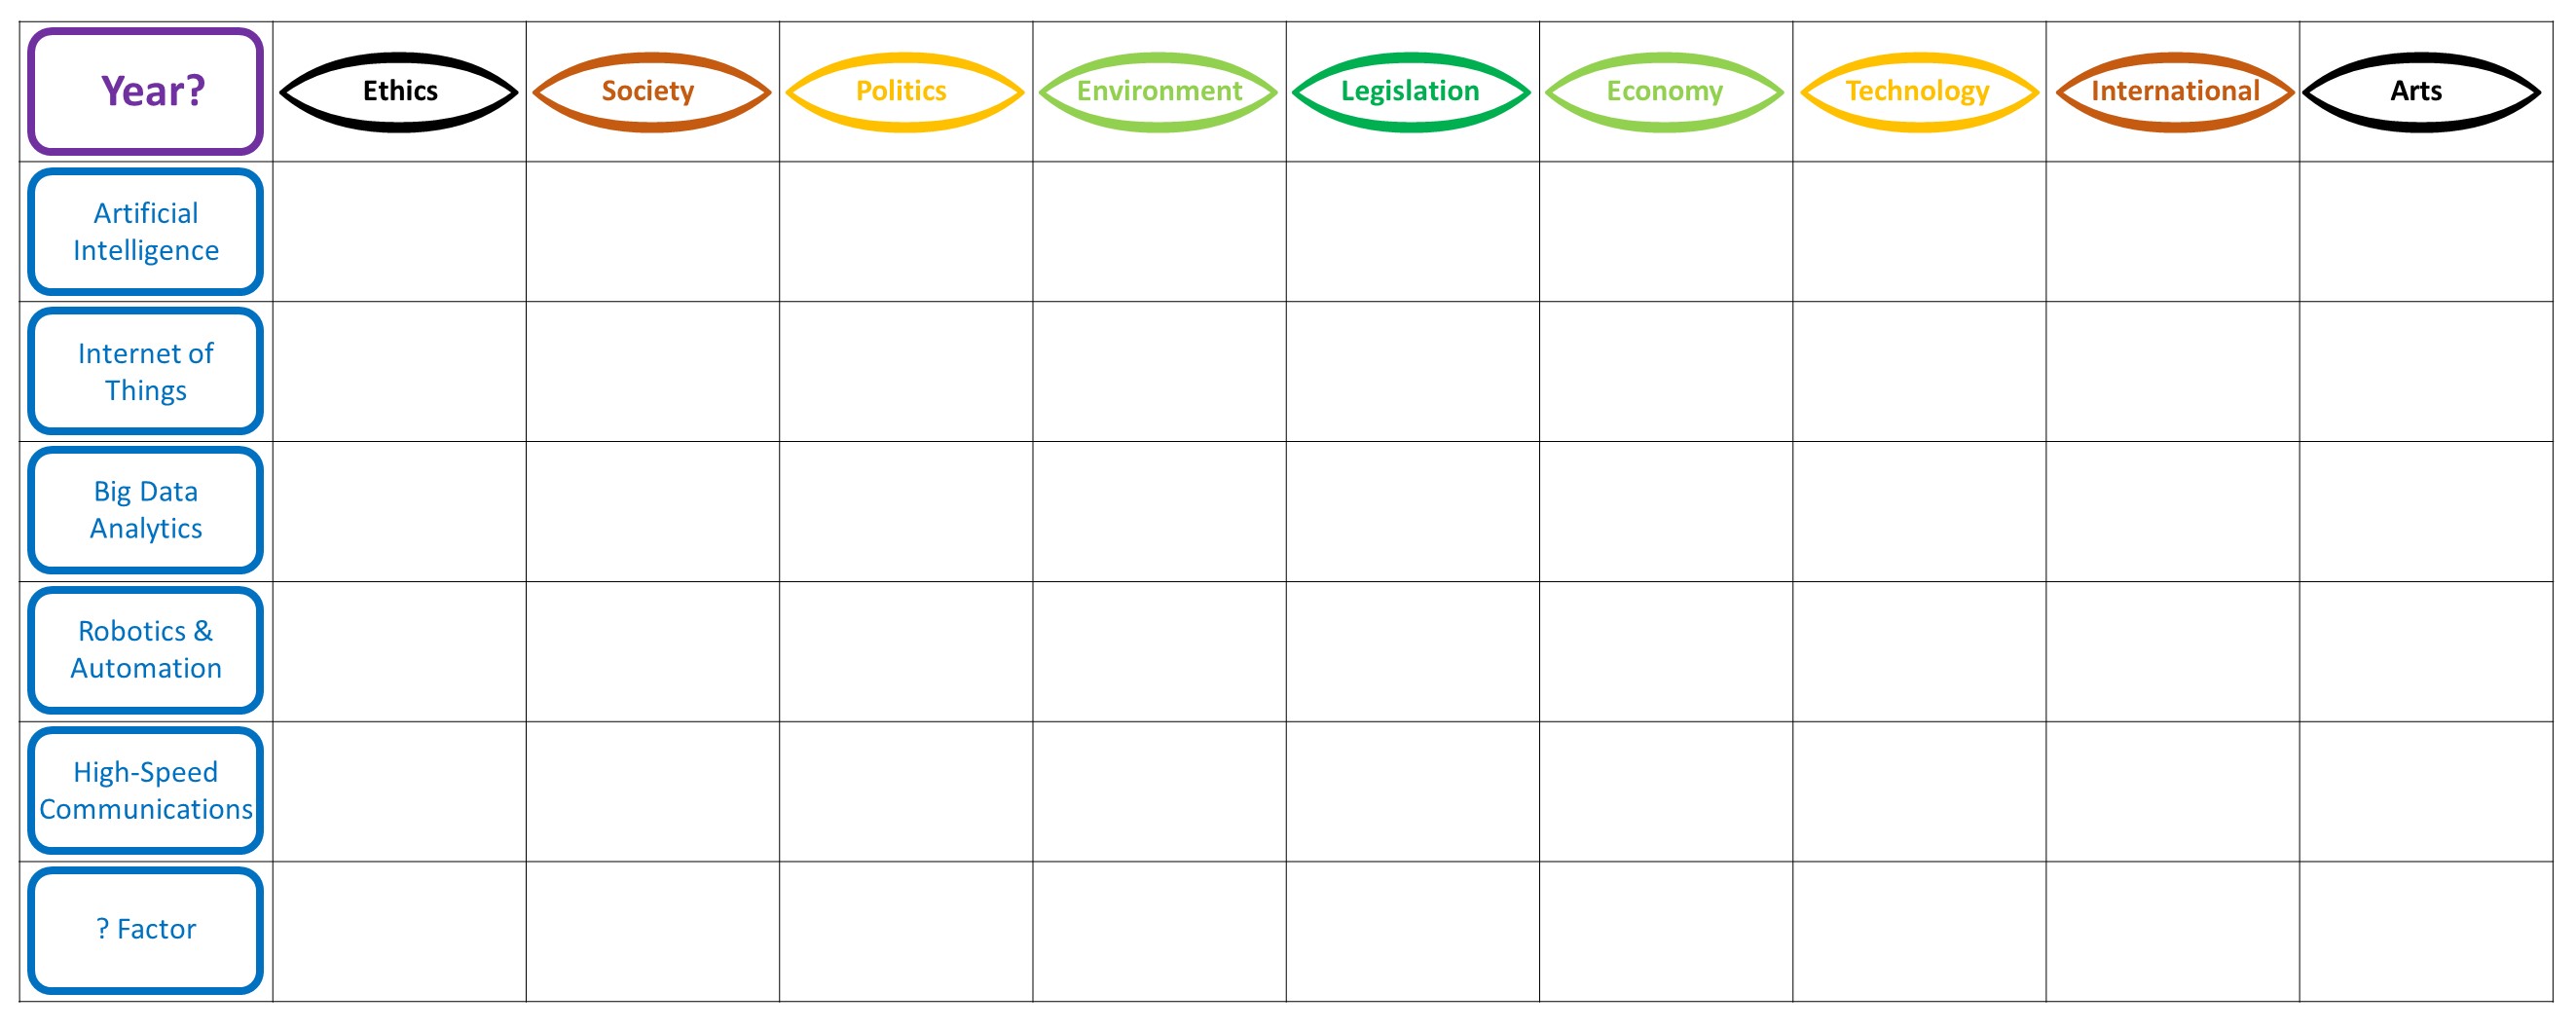
Placing ESPELETIA on the x-axis and the key drivers on the y-axis gives us The Futurology Grid.
Now what to do with it?
Well, firstly how to interpret the table. Each cell, with an X dimension and a Y technology, should be read as:
“How will Y impact upon, or be influenced by, X?”
which is the kind of thinking needed for a ‘first pass’ of the table.
Of course, cells such as ‘How will technology Y impact upon, or be influenced by, technology?’ may look silly. But they can either be ignored for a first pass or considered in the sense of ‘How will technology Y impact upon, or be influenced by, other technologies?’, which makes a start on the more complex issue of considering the different technologies working together. But this Futurology Grid, in itself, is a useful exercise for now.
The purpose of the top-left ‘Year?’ cell is simply to identify how far ahead we’re looking. It can be written as an absolute (e.g. 2030) or relative (e.g. ‘next year’ or +10 years) time. That gives a focus on a specific year, rather than some vague sense of evolution, but a sequence of such grids – properly reflected upon – would give a more considered progression and final prediction.
Here’s a version of the grid with a blank for the year to be filled in:

Or, if preferred, an editable Word version.
Then the next phase would be to discuss more sophisticated implementations of this timeline analysis.
But that’s for another ‘time’ …


January 23rd, 2024 at 11:57 am
[…] recommended that both A New Futurism Tool: ESPELETIA and The Futurology Grid are read before this post. These contain some extra detail that will only be summarised […]